
The Math Behind Why Most B2B Marketing Budget Gets Wasted
SAASGROWTH
2/17/20265 min read
Most B2B marketing teams running paid media at scale share a common blind spot: they treat their Total Addressable Market as one homogeneous group. It isn’t. And the cost of ignoring that distinction is measurable.
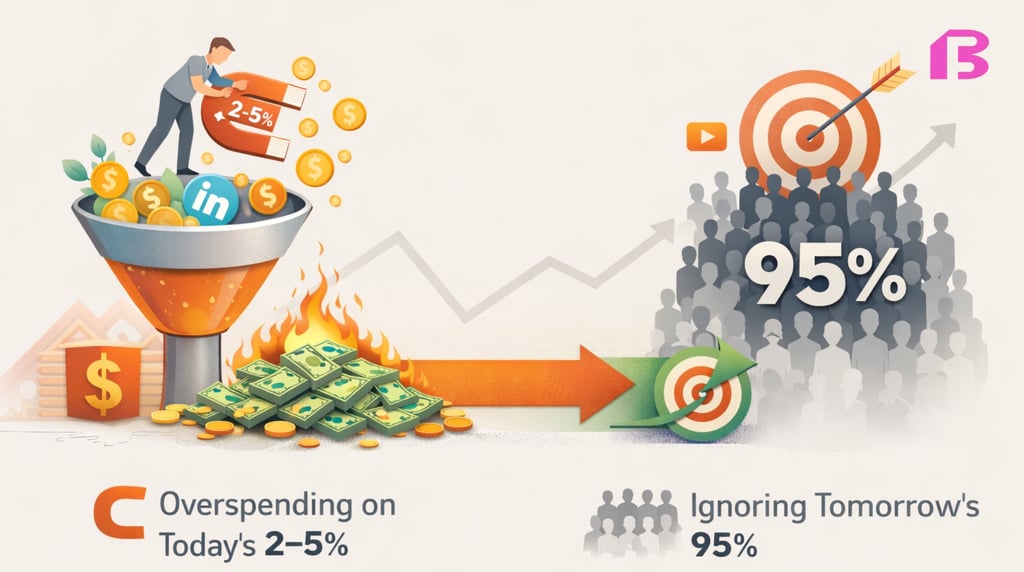
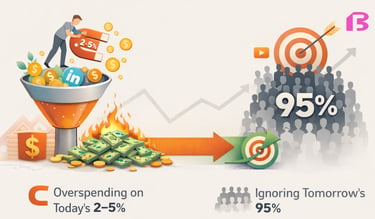
At any given moment, roughly 2–5% of the market is actively evaluating a solution like yours. They are close to a purchase decision. The remaining 95%+ will buy, often within 6–18 months, but they are not in-market today.
Most paid media programs allocate the majority of the budget toward that 2–5%, while the 95% who will buy later receive a fraction of the investment.
This creates a compounding problem that shows up slowly, then all at once: CAC rises, pipeline quality declines, and spend has to increase every quarter just to maintain the same revenue line.
Start with the Conversion Math
Before debating channels or creative, run a split-funnel analysis. Separate leads into two groups:
High-intent conversions (demo requests, “contact sales” forms, free trial sign-ups): convert to qualified opportunity at 25–40%
Low-intent conversions (ebook downloads, gated content, webinar registrations): convert at 2–8%
That’s a 5–10x difference.
Yet in most B2B programs, the majority of paid spend flows toward low-intent leads, because those campaigns produce higher volumes and look better in dashboards.
The diagnostic question isn’t “how many leads did we generate?”
It’s:
What percentage of paid budget funds conversions that close at 25–40% versus 2–8%?
Most teams find the answer uncomfortable.
Two Distinct Problems, Two Distinct Approaches
Once the in-market vs not-in-market split is clear, the paid media problem becomes two separate challenges:
Capturing demand that already exists
Creating demand that doesn’t exist yet
Trying to solve both with one motion is where the waste begins.
Capturing Demand That Already Exists
Paid search, high-intent retargeting, and bottom-of-funnel conversion optimization belong here.
This part is often treated as a traffic problem. In reality, it is usually a conversion problem.
Most teams over-invest in click acquisition and under-invest in the landing page, the qualification flow, and the follow-up sequence that determines whether a click becomes an opportunity.
The most practical measurement shift is simple:
Measure cost per qualified opportunity, not cost per lead.
That single change forces the right conversations.
Creating Demand That Doesn’t Exist Yet
The 95% who aren’t evaluating today will become buyers on their own timeline. The question is whether your company will be in their mental shortlist when that timeline starts.
Thought leadership, video content, category education, and brand presence build familiarity before buyers enter an active evaluation.
Companies that have been in buyers’ minds for 12 months before an evaluation begins win at a structurally different rate than companies that appear only at the moment of search.
A consistent pattern shows up across B2B programs that shift toward demand creation:
Sales cycle length compresses
Pipeline quality improves
Cost to close decreases
Lead volume from paid media declines
Demand creation doesn’t produce leads this quarter. It produces shorter sales cycles and better pipelines 2–4 quarters from now.
That timeline mismatch is why most companies chronically under-invest here, not because they don’t believe in it, but because quarterly reporting makes it hard to defend.
The Measurement Gap That Makes This Hard
Standard CRM attribution (last-touch, first-touch, linear) makes demand creation invisible.
A demo request gets attributed to the paid search click. The LinkedIn video watched three months earlier, the podcast episode that put the company on the buyer’s radar, the referral conversation that shaped the shortlist, none of that appears. So it gets cut.
A more complete picture requires three data sources:
Software attribution for trackable touchpoints
Directionally useful, but structurally incompleteSelf-reported attribution from “how did you hear about us?” fields
Captures dark social and word-of-mouth that software missesPost-sale customer interviews
The most accurate view of what actually drove the decision
When all three sources align, investment becomes straightforward.
When they conflict, that gap is the most valuable learning in the program.
Patience as a Strategic Variable
Demand creation strategies should be evaluated over a minimum of two full sales cycles.
If the average cycle is 90 days, at least 180 days are required before drawing conclusions.
The most common failure mode is predictable:
A company shifts budget toward demand creation, sees lead volume dip, sees no offsetting pipeline improvement after 60 days, panics, and reverts.
The strategy wasn’t wrong. The evaluation window was.
Set the expectation explicitly at the C-suite level before the program launches:
What data would be required, and over what time period, before this would be considered a failure?
That one conversation prevents expensive backtracking.
The Business Case for Leadership
Leadership budget decisions don’t move on theory. They move on trailing data.
Pull eight quarters of:
Pipeline production
Total marketing ROI
CAC by cohort
Sales cycle length
Pipeline velocity
For most companies that haven’t evolved their go-to-market approach in several years, these numbers tell a consistent story: declining efficiency despite flat or increasing spend.
Then build a forward-looking scenario:
Current trajectory projected 12 months out
A phased transition projected over the same period with conservative assumptions
Quantify the delta in pipeline and CAC.
The CFO conversation usually hinges on one question:
Can the phased approach manage downside risk while creating a credible path to better unit economics?
Where BriskFab Comes In
The analysis above is diagnostic.
Executing on it, reallocating budget, rebuilding attribution infrastructure, and shifting a team’s operating rhythm requires senior judgment at the GTM level. That is the gap BriskFab’s Fractional CMO engagements are built to close.
For B2B SaaS and tech companies between $1M–$20M ARR, most marketing problems aren’t execution problems. They are senior decision-making problems.
A Fractional CMO provides embedded GTM leadership: sharpening ICP and positioning, restructuring the balance between demand capture and demand creation, aligning marketing to revenue, and owning outcomes without the cost or commitment of a full-time hire.
If trailing data shows declining pipeline efficiency, flat brand search volume, or lengthening sales cycles, the starting point isn’t a new agency.
It’s a strategy conversation with BriskFab.
FAQ’s
Why do B2B companies waste so much of their marketing budget?
The root cause is optimizing for what’s measurable rather than what drives revenue. Lead volume from low-intent campaigns is easy to track and scale. The downstream conversion quality often takes months to surface, by which point the budget decision has already been made.
How should the right budget split be determined?
It depends on stage, sales cycle length, category maturity, and where the business currently under-indexes. The diagnostic signals in this article are a better starting point than any universal ratio. Most struggling B2B programs will find they are over-indexed on capture and under-indexed on creation.
How can demand creation be measured if it doesn’t produce leads this quarter?
Layer three sources: software attribution, self-reported attribution, and post-sale customer interviews. Brand search lift and organic traffic growth are useful leading indicators. The lagging indicator that matters is sales cycle length compression and pipeline quality improvement over 2–4 quarters.
How long before results show up from demand creation?
Evaluate over a minimum of two full sales cycles. If the cycle is 90 days, that’s at least six months. Set that expectation with leadership before the program starts, not after the discomfort of a lead volume dip arrives.