
B2B Pipeline Velocity Formula: Find & Fix Revenue Leaks
FRACTIONAL CMOGROWTH
6/18/20268 min read

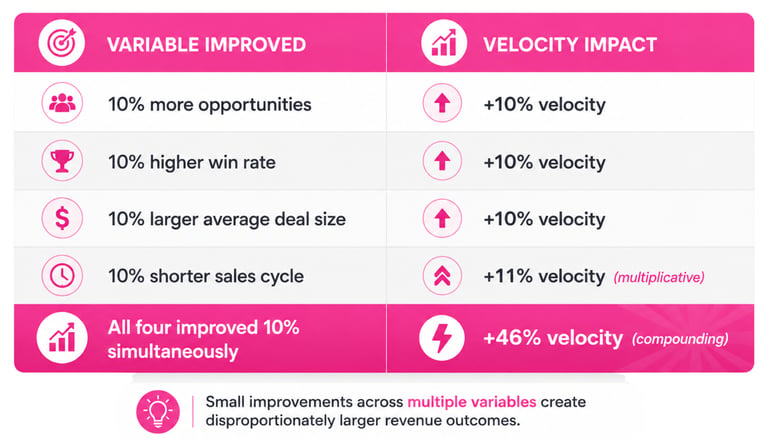
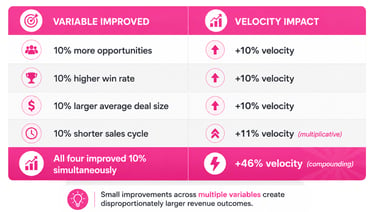
Small, parallel improvements across all four levers produce dramatically better outcomes than a major push on any one of them. A 10% improvement on every lever simultaneously doesn't produce 40% velocity growth, it compounds to roughly 46%. That's the arithmetic of the formula working in your favor.
The pipeline velocity optimization challenge is fundamentally a systems challenge. It requires marketing, sales, and revenue operations working from shared definitions, shared metrics, and shared accountability.
The Revenue Leader's Pipeline Velocity Audit Checklist
Before optimizing, assess where you actually stand:
Do we track pipeline velocity as a consistent RevOps metric, reviewed at least monthly?
Is our pipeline conversion rate improving quarter-over-quarter across key stages?
Do we know the primary causes of deal stagnation, and at which stage?
Are win-rate trends segmented by channel, buyer persona, and deal size?
Do we have an active strategy for increasing average deal value?
Are marketing and sales aligned on a documented definition of a qualified opportunity?
Is pipeline velocity included in board-level forecasting discussions, not just sales reviews?
This checklist is a diagnostic, not a scorecard. Most organizations have three to four of these items in good shape. The gaps are where the revenue leakage lives.
Revenue Efficiency Is a System Problem, Not a Sales Problem
Pipeline velocity isn't a number you track for its own sake. It's a lens that forces a company to look at its entire revenue system, from how demand is generated to how deals are structured to how quickly internal processes move, as a connected whole rather than a collection of isolated functions.
Organizations that treat velocity as a board-level metric, not just a sales dashboard item, consistently build more predictable, capital-efficient revenue engines. They don't grow by doing more of the same. They grow by doing the same things more efficiently, and the velocity formula tells them exactly where to start.
Want to Know Where Your Revenue Engine Is Slowing Down?
Most revenue teams don't have a pipeline problem. They have a velocity problem, and those are two very different diagnoses that demand two very different fixes.
At BriskFab, this is exactly the kind of revenue challenge we are built for. We work with B2B founders and revenue leaders to identify precisely which of the four levers is generating the most drag in their pipeline, and build the operational framework to fix it. Not generic advice. Not a templated audit. A focused, executable engagement built around your deal profile, your cycle, and your numbers.If your pipeline looks healthy but revenue keeps falling short, that gap has a cause. We will find it.
Book a Review with BriskFab and walk away with a clear picture of where your revenue engine is losing speed, and exactly what to do about it.
Frequently Asked Questions
What is the B2B pipeline velocity formula?
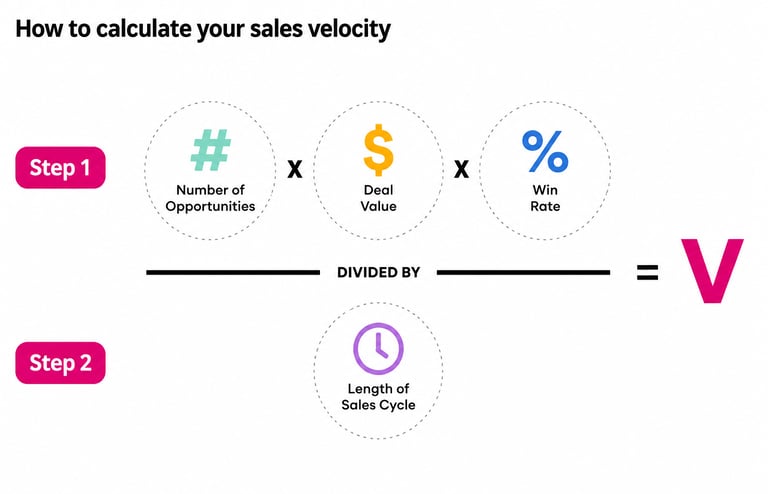
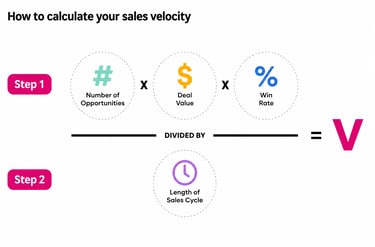
Pipeline velocity equals the number of qualified opportunities multiplied by win rate and average deal size, divided by sales cycle length. The result tells you how many dollars of expected revenue move through your pipeline per day.
Why should I track velocity instead of pipeline volume?
Pipeline volume tells you what might happen. Velocity tells you how efficiently it's happening. A large pipeline with slow deal progression will consistently underperform a smaller, faster pipeline.
Which lever in the pipeline velocity formula is easiest to improve quickly?
Win rate and sales cycle length typically offer the fastest returns because they are heavily influenced by internal process changes, qualification discipline, follow-up speed, and proposal quality, rather than external market factors.
How often should revenue teams review pipeline velocity?
At minimum monthly, but in our experience working with B2B revenue teams, weekly reviews create meaningfully faster course corrections. Velocity problems identified mid-month are still fixable. Velocity problems surfaced at quarter-end are not.
Is pipeline velocity relevant for companies below $1M ARR?
Yes. The formula applies at any scale, though the specific benchmarks shift. Even early-stage teams benefit from understanding whether they're losing on win rate, deal size, or cycle length, each requires a different response.
What is a healthy win rate for B2B sales?
Benchmarks vary significantly by deal size and segment. Mid-market B2B teams typically see win rates in the 20–35% range. The more important question is whether your win rate is trending in the right direction and whether it's consistent with your pipeline quality.
How does sales cycle length affect overall pipeline velocity?
Because cycle length is the denominator, reductions have a multiplicative effect on velocity. A 20% compression in cycle length produces approximately a 25% velocity improvement, all else being equal, making it one of the highest-leverage single adjustments available.
Most B2B revenue leaders spend their careers chasing a number that doesn't tell the whole story. Pipeline size feels like progress. A full CRM feels like momentum. But when the quarter closed short, again, and the pipeline was technically "healthy," the problem was never volume. It was speed, the rate at which opportunity was actually converting into revenue
That rate has a name and a formula. The B2B pipeline velocity formula is the single equation that connects every major function of a revenue organization, demand generation, sales execution, deal management, and process efficiency, into one operational number. It tells you not just what might close, but how fast your engine is actually running. And right now, for most B2B teams, that engine is running slower than it looks.
The median B2B sales cycle has lengthened 22% since 2022, current 2026 benchmarks show the average B2B win rate sits at 21% across all opportunities, rising to 29% when only qualified opportunities are counted, and buying committees have grown to an average of 13 stakeholders per deal. In that environment, the teams still hitting their numbers aren't the ones with the biggest pipelines. They're the ones who understand precisely where their pipeline is losing speed, and which lever to pull first.
Bigger Pipeline Won't Save Your Quarter
Here's a pattern most revenue leaders recognize: the pipeline looks full, the forecast looks reasonable, and then the quarter closes short. Again.
The instinct is to generate more leads, add more SDRs, or pressure marketing for more volume. But more pipeline without better velocity is just more noise. The deals are there. They're just moving too slowly, or not moving at all.
That's exactly what this metric was built to diagnose. It doesn't measure how much opportunity exists. It measures how efficiently your revenue engine converts that opportunity into actual revenue, and how fast.
Modern RevOps teams increasingly treat velocity as their north-star operating metric because it surfaces what volume-based metrics hide: qualification gaps, deal stagnation, pricing friction, and misaligned sales cycles. If you're responsible for predictable revenue growth, this is the framework worth understanding in depth.
The B2B Pipeline Velocity Formula, Explained
The output is your daily revenue generation rate, the dollars of expected revenue flowing through your pipeline each day. What makes it powerful isn't the math. It's the fact that it connects four distinct operational functions, demand generation, sales effectiveness, deal management, and process efficiency, into a single number.
Consider a simplified baseline scenario: 100 qualified opportunities, a 25% win rate, a $40,000 average deal size, and a 90-day sales cycle. That produces a daily velocity of roughly $11,111.
Now increase win rate by 5 percentage points, just one lever, and daily velocity jumps to $13,333, a 20% lift without a single additional lead generated. That compounding dynamic is what makes velocity optimization one of the highest-leverage activities in a revenue organization.
The formula functions as a diagnostic as much as a metric. If velocity is declining, it tells you where the engine is losing efficiency, not just that something is wrong.
Deconstructing the Four Levers That Drive Pipeline Velocity
Lever 1: Increasing Qualified Opportunities
More leads is not the same as more qualified opportunities. This distinction matters enormously for pipeline velocity. Unqualified volume dilutes win rates, extends cycles, and wastes sales capacity on deals that were never going to close.
The bottleneck here is usually at the top of the funnel: weak ICP definition, demand generation targeting that prioritizes clicks over fit, or a mismatch between marketing's definition of a qualified lead and what sales actually needs.
The fix requires tightening, not expanding. ICP refinement, intent data utilization, and account-based targeting all reduce the number of opportunities entering the funnel while improving the quality of those that do. When sales and marketing agree on what a qualified opportunity actually looks like, velocity responds quickly.
What this lever moves: More qualified pipeline entering the formula at the top. Every additional well-fit opportunity multiplies across all the other variables.
Lever 2: Improving Win Rate
The average B2B win rate sits at 21% across all pipeline opportunities in 2026, but that number jumps to 29% when only qualified opportunities are counted. That 8-point gap is not a coincidence. It represents deals that should never have entered the pipeline in the first place, consuming rep time, CRM coverage, and management attention on opportunities that had no realistic path to closing. For most revenue teams, the win rate isn't falling because reps can't close. It's falling because the pipeline itself is miscalibrated at the entry point.
The more important question is where win rate is actually being lost, and for most B2B teams, it isn't at the close. It's earlier. Discovery calls that don't go deep enough to surface real urgency. Deals that enter the pipeline without a confirmed budget or a genuine internal champion. Single-threaded cycles where only one stakeholder is engaged until it's too late. By the time a deal stalls or dies, the damage was usually done two stages back.
Practical improvements come from stronger discovery disciplines, consistent qualification frameworks, sharper competitive positioning, and better sales enablement at the proposal stage. A 5-point improvement in win rate from 20% to 25% produces the same velocity impact as a 25% increase in pipeline volume. The math strongly favors quality over quantity.
Lever 3: Increasing Average Deal Size
Average deal size has held relatively stable in recent years, making this the one velocity lever where the structural trends aren't working against you.
The constraint is typically how deals are positioned, not how they are priced. Single-threaded selling, engaging only one stakeholder in a buying group that now averages 13 decision-makers according to Forrester's The State of Business Buying 2026, consistently produces smaller deals. . When a conversation stays at the manager level, the solution gets scoped as a departmental tool. When it reaches the CFO or COO, it becomes a strategic investment, and pricing conversations shift accordingly.
Value-based positioning, enterprise packaging, and deliberate cross-sell strategies all push average deal size upward. These changes don't require more leads or more reps, they require better deal architecture and stakeholder engagement models.
Lever 4: Reducing Sales Cycle Length
This is the lever where the external environment is most actively working against revenue teams right now. The median B2B sales cycle now runs approximately 84 days, and has lengthened 22% since 2022, according to the Optifai Pipeline Study of 939 B2B companies. Breaking it down by deal size: deals under $25K close in roughly 90 days, mid-market deals between $25K–$100K take 3 to 6 months, and enterprise deals above $100K regularly run 6 to 9 months or longer
The drivers are structural: larger buying committees, increased CFO scrutiny post-2022, and buyers who are genuinely more cautious. Post-2022 budget pressure has pulled CFO involvement into purchases that previously only needed VP approval, and security reviews, SOC 2, GDPR, vendor risk assessments, now add 2 to 4 weeks to the average mid-market cycle before procurement even begins.
But sales cycle length also has internal causes, and these are addressable. The most effective interventions are:
Automated workflows that eliminate manual follow-up delays and keep deals moving between stages without relying on rep memory
Buyer enablement content that helps the champion sell internally, reducing the back-and-forth that stalls deals waiting for internal sign-off
Pre-built security and legal packages that remove procurement friction at the final stages, where deals most commonly stall in enterprise cycles
Early multi-threading, engaging multiple stakeholders before the committee meeting, not after, so no single point of contact becomes a single point of failure
Outreach's sales benchmark data makes the urgency concrete: deals closing within 50 days carry a 47% win rate, while opportunities that stretch beyond that window drop to 20% or lower, meaning every week a deal stalls, the probability of closing it compounds downward.
Which Variable Creates the Greatest Revenue Impact?
The honest answer is that optimizing all four simultaneously beats any single-lever push. But the compounding arithmetic behind that is worth understanding.